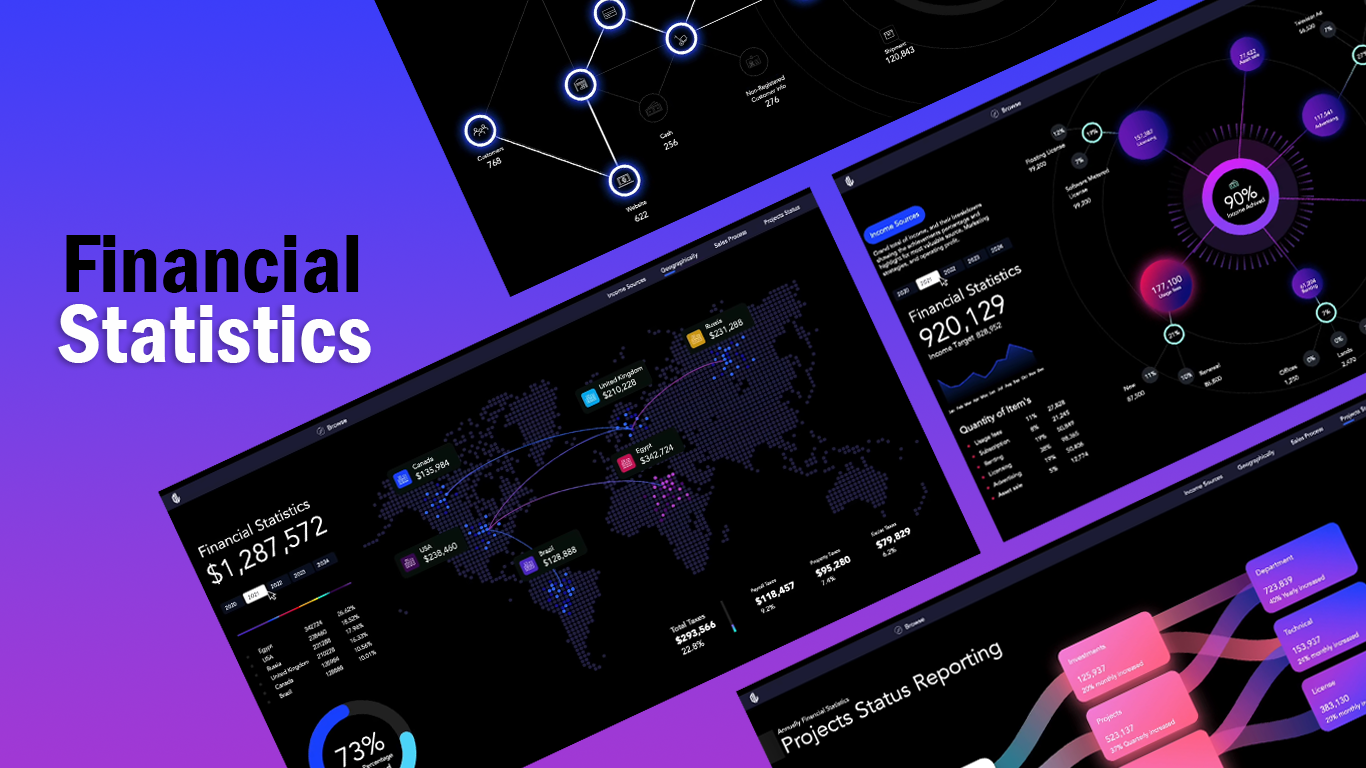
Financial Statistics Dashboard
An advanced financial dashboard that provides in-depth analysis of the company's performance, including income sources, geographical insights, sales processes, and project status. With multiple pages of detailed visualizations, it enables strategic decision-making, while the user-friendly interface and interactive visuals enhance financial management, planning, and overall business insights.
Tech Stack:
Date
10, September 2024
Category
Dashbaord, EDA, Business Intelligence
Tools & Language
Power BI, DAX, M language
Key Features:
-
Income Sources:
Displays total income and breakdowns, highlighting achievements and key profit sources.
-
Geographical Insights:
Visualizes income across different regions to identify high-performing areas.
-
Sales Process:
Analyzes the efficiency of sales through various channels, providing insights into customer engagement and order processing.
-
Project Status:
Tracks ongoing projects and their financial implications to ensure alignment with strategic goals.